Monday, July 5, 2010

Isotachs

Isotachs


http://www.atmos.washington.edu/~mcmurdie/oct96/oct96_labs.html

Isotachs are lines along which the speed of the wind is constant and consistent. Isotachs are generally represented on surfaces of constant elevation or atmospheric pressure.

Isobar

Isobar


http://www.newmediastudio.org/DataDiscovery/Hurr_ED_Center/Hurr_Structure_Energetics/Closed_Isobars/Closed_Isobars.html

Isobars are lines of equal atmospheric pressure drawn on a meteorological map. Each line passes through a pressure of a given value. This is an example of closed isobars around a low pressure cell.

LIDAR

LIDAR


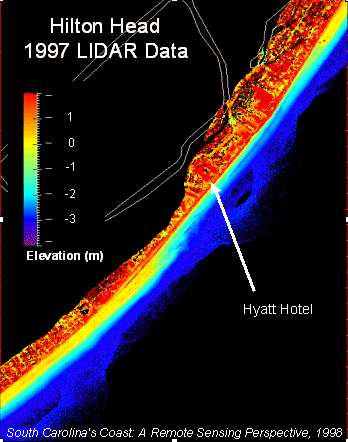
http://www.csc.noaa.gov/products/sccoasts/html/tutlid.htm

LIDAR is an acronym for Light Detection And Ranging. It can measure distance, speed, rotation, chemical composition, and concentration of a remote target where the target can be a clearly defined. It can also locate or a diffused object such as a smoke plume or clouds. This is a LIDAR image collecting topographic data on the coast of South Carolina.

Doppler Radar

Doppler Radar


http://www.weatherusa.net/blog/index.php?month=August_2004

Doppler Radar is a weather radar system that employs the apparent shift in frequency of radio waves to perceive air motion. This enables it to predict tornadoes, hurricanes, and precipitation sooner than previous radars. Additionally, it provides information on the speed and direction of rain and ice. This is a Doppler Radar image of Hurricane Frances hitting Florida.

Black & White Aerial Photo

Black & White Aerial Photo


http://www.fas.org/irp/imint/docs/rst/Sect21/Examq21.html

Black and white aerial photography is used along with color infrared films today. It is still used in both high and low altitude aerial photography. This is a black and white aerial photo of Bloomsburg, Pennsylvania.

Infrared Aerial Photo

Infrared Aerial Photo


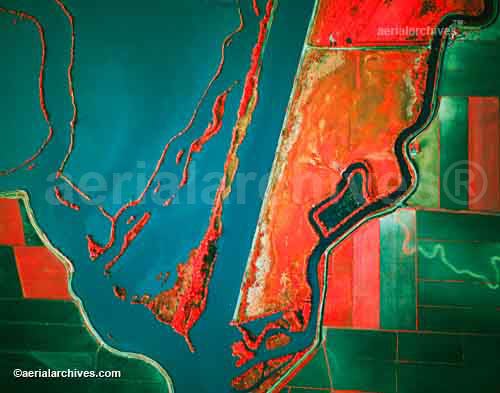
http://www.aerialarchives.com/Infrared-Aerial-Photography.htm

Infrared aerial photography can be used to document changes to the environment, the health of forests, wetlands, bays and oceans, etc. It can also be used to document and monitor such items as damage to roofs. This is a photo of Sacramento River Deep Water Ship Channel and Levees.

Cartographic Animations

Cartographic animations


http://libraries.maine.edu/Spatial/gisweb/spatdb/gis-lis/gi94078.html

In cartography, animation is usually defined as the depiction of change through time. It is the illusion of movement in a map. This is an animation that depicts the change in the percent of population over 65 in the United States.